Showing posts with label graph. Show all posts

Wednesday, May 24, 2017

Applications: A list of projects using eigenthings

Eigenthings

Gould's accessibility index in a network - The process uses a modified adjacency matrix and the components of the eigenvector associated with the dominant eigenvalue. Students find this approachable and adaptable.  Applications to historical geography, air traffic.

Discrete dynamical systems - Using linear algebra to study discrete dynamical systems comes in several flavors.  Here are some projects that students find interesting and that differ from each other enough that they feel they are not repeating someone else's project.


  • Difference equations and the Fibonacci sequence - Using eigenvalues to write the product of the nth power of a diagonalizable matrix and an initial vector allows one to write a closed form for a recursive formula.  Matrices of size 2x2 are needed to write the closed form of the nth Fibonacci number, but students can easily move from there to the closed form of 3rd and 4th order difference equations.  This project is always chosen by some student even though it is not applied to a real-world situation.

Friday, July 30, 2010

Euler Characteristic and Planar Graphs

To the right we see a planar graph. It divides the plane into 5 regions which I have labeled A, B, C, D and E. We call region D a triangle because it has three sides. Regions B, C and D are quadrilaterals since they have 4 sides. Even though A is an infinite region in the plane, it has 3 sides and is called a triangle. The question we address here is whether we can draw planar graphs with all possible combinations of triangles, squares, pentagons, etc., or not. Also, can we determine which combinations are possible?

We will use the Euler Characteristic for the sphere to solve this problem. I know it looks like the figure above is drawn on the plane, but you can also think of it as drawn on a relatively flat part of a sphere. In this way, region A is not infinite, but we will still call the regions triangles, quadrilaterals, pentagons, etc., even though they now have a curve to them. The Euler Characteristic is VE + R, where V = number of vertices, E = number of edges (not the region E above) and R = number of regions. The Euler Characteristic depends only on the surface on which the planar graph is drawn, and not the shape of the graph. For the sphere,

VE + R = 2,

always. In the example at the above, VE + R = 6 – 9 + 5 = 2.

Let’s do a little counting. In the figure above, E = 9 is the number of edges. However, if we count the sides of the polygons we get 2 triangles x 3 sides each + 3 quadrilaterals x 4 sides each = 18 sides. This is twice as many as the edges, because polygon each side is counted twice for each edge, once for the polygon on one side of the edge and once for the polygon on the other side of the edge. For instance, in the edge count, E, the edge xy is counted for the triangle D and the quadrilateral C.

What about the vertices? In the figure above V = 6is the number of vertices. If we count the vertices of the polygons we get 2 triangles x 3 vertices each + 3 quadrilaterals x 4 vertices each = 18. In this case, we get three times as many polygon vertices as graph vertices because there are three polygons meeting at each vertex. For example, polygons A, B and C meet at vertex t.

These counting techniques and the Euler Characteristic will give us a system of equations for finding whether graphs with certain combinations of polygons are possible. 

Example 1: Can we draw a planar graph with only triangles so that exactly three triangles meet at each vertex? If so, how many triangles will there be? We can answer this question with a system of linear equations. The first equation is the Euler Characteristic for the sphere:

VE + R = 2.

Each region is 3 sided, but if we count 3R sides that will be double the edges since each side is counted twice:

3R = 2E.

Each region has 3 vertices, but if we count 3R vertices that will be triple the total vertices since three triangles meet at each vertex:

3R = 3V.

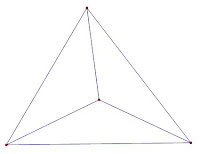
Solve this square system of 3 equations in 3 unknowns using your favorite method, and we find there is only one way to do this:

V = 4, E = 6 and R = 4.

The only solution is to have 4 triangles, 4 vertices and 6 edges as shown on the right, remembering that the outside region is a triangle.  So, we could never draw a graph that had 5 triangles such that 3 triangles meet at each vertex.  Give it a try to see why it can't be done.

Questions: Can we draw a planar graph of triangles where 4 triangles meet at each vertex? 5 triangles meet at each vertex? 6 triangles meet at each vertex? How would we change the system above to answer these questions.  If the graph exists, try to draw it. 

Example 2: What if there are two different types of polygons? Consider a graph of triangles and quadrilaterals, assuming that three polygons meet at each vertex. We will introduce two new variables: T and Q, the counts of the triangles and quadrilaterals, respectively. Now, the total number of regions is the sum of the two types of polygons,

T + Q = R.

Count the edges, 3 for each triangle and 4 for each quadrilateral, and as in Example 1, this counts each edge twice:

3T + 4Q = 2E.

Count the vertices, 3 for each triangle and 4 for each quadrilateral, and as in Example 1, this counts each vertex thrice, because 3 polygons meet at each vertex:

3T + 4Q = 3V.

Finally, we need the Euler Characteristic:

VE + R = 2.

This time we’ll use a matrix and row reduction to get the solution. The system is underdetermined, so we expect to get infinitely many solutions.


Sure enough, we have a free variable and we can write the general solution as

T = 12 – 2R,
Q = –12 + 3R,
V = –4 + 2R and
E = –6 + 3R.

But in this application, the values of T, Q, V and E have physical meaning and must be positive. If V or E is zero, then the graph would be empty. We could assume that T or Q is zero, but we are interested in graphs with both triangles and squares. Now we can solve the inequalities below to see if there is a viable solution, and how many there are.

T = 12 – 2R > 0      =>      R < 6
Q = –12 + 3R > 0      =>      R > 2
V = –4 + 2R > 0      =>      R > 2
E = –6 + 3R > 0      =>      R > 4

Okay, R is an integer and strictly between 4 < R < 6, so R = 5 is the only realistic solution to this underdetermined system. Now,

R = 5, T = 2, Q = 3, V = 6 and E = 9.

Draw this graph (don’t forget that the outside region is one of the 5 regions and must be either a quadrilateral or a triangle). The graph is at the bottom of this blog, but don’t peak before you give it a try.

Questions:

1. Can you draw a planar graph with pentagons and hexagons such that three polygons meet at each vertex? If so, how many of each polygon are there? Can you draw them?

2. Can you draw a planar graph with triangles and quadrilaterals such that four polygons meet at each vertex? I have written the equations and solved the system for this case, and this may have infinitely many solutions, but I haven’t had the time to draw more than two of the solutions and would like to see an algorithm for drawing all of them.

3. Other surfaces, such as a torus (donut) have different Euler Characteristics. How does one draw a graph on a torus? What are the solutions to the questions above if the graphs live on a torus?  Wolfram MathWorld has a list of the Euler Characteristics for surfaces, but WikiPedia has nice images of those surfaces if you scroll to the bottom of the article.

To limit this blog to a few pages, a lot is left unsaid. But again, these posts aren’t meant to give an in-depth discussion of the topic, but just an introduction.  Go exploring for more about this topic.

Reference: Alain M. Robert, An Approach of Linear Algebra through Examples and Applications

Wednesday, July 21, 2010

Gould Index - Matrix Application to Geography

Figure 1:
Map of 7 towns connected by 9 roads
The Gould Index has a nice visual that students enjoy, but it also is used to answer a question (important for applications) and can lead to discussions of the PageRank function used by Google.  Much of this post is adapted from a paper by Patrick Carlson, one of my linear algebra students.  He was interested in networks, and did a great job of understanding and explaining the general nature of the mathematics behind the Gould Index.

Example 1:  Consider a graph that respresents a set of towns (the vertices) and the travel routes between those towns (the edges) like in Figure 1.  Historical geographers were interested in which town would become the trade center for this region.  Now, you are saying to yourself that this is obvious in this picture, but let's see if some mathematics can come to the same result we do.  If so, then let's apply it to a less obvious graph.

Figure 2:  Adjacency matrix for Figure 1
First, make the adjacency matrix for the graph (Figure 2).  Place a 1 in position (U, V) when U and V have a travel route between them and a 0 in the (W, T) position when there is no direct travel route between W and T.  We will also place a 1 in each diagonal position, such as (Q, Q) as if there was a loop there, since clearly if you are in Town Q you can obviously get to Town Q.  Notice that this matrix is symmetric, which will make some of the mathematics work but is also a way of checking to make sure you created the matrix correctly.

Now, here's the math.  Find the eigenvalues of this matrix and find the largest one in absolute value.  We get eigenvalues (2, 0, 4, -1, 0, 2, 0).  The third one, 4, has the largest absolute value.  Now, find the eigenvector associated with the eigenvalue of 4: 
(0.3162, 0.3162, 0.3162, 0.3162, 0.6325, 0.3162, 0.3162).  Normalize this vector by dividing by the sum of the entries, 2.5297, to get

(Q, R, S, T, U, V, W) =
(0.125, 0.125, 0.125, 0.125, 0.25, 1.25, 1.25).

These are the Gould indices of each of the vertices, which describes how strongly each vertex is connected to the other vertices.  As we knew, U is the most strongly connected with a Gould Index of 0.25, and the others are equally connected because of the symmetry of the graph.

Figure 3:  Another graph
Example 2:  What if we looked at a graph that more realistically represents a set of towns, which may have rivers, mountains or other geographical features preventing travel routes between towns, as in the graph in Figure 3.  In this case, would G be the trade center because it is directly connected to the most towns, or would it be C because between C and every other town is at most one town?  Create the adjacency matrix (with ones along the diagonal), and find the eigenvalues which are
(4.01, -1.37, 1.71, 1, -0.37, -0.56, 2.58, 1, 1).  The first is the largest and the eigenvector associated with it is
(0.2941, 0.4097, 0.5023, 0.3249, 0.3026, 0.1359, 0.4770, 0.1583, 0.1583) and the sum of the entries is 2.7631.  Normalize by dividing by the sum of the entries to get the Gould indices:

(A, B, C, D, E, F, G, H, I) =
(0.1064, 0.1482, 0.1818, 0.1176, 0.1095, 0.0492, 0.1726, 0.0573, 0.0573).

Of course, we can see which Gould index will be largest before normalizing, but there are other applications for which normalized values of the eigenvector will have meaning, so it doesn't hurt to get used to normalizing.  We see that C has the largest Gould Index with 0.18, but G comes in a close second with 0.17.  In this calculation, more value is given to vertices that are closer to others along paths of length more than 1 than to vertices that connect with a path of length 1 to more vertices.  Note that I and H have the same smallest index, as expected.

What is going on?  Although we have some empirical evidence that the Gould index does what is expected, what is the theory behind it?  A version of the Perron-Frebonius Theorem says that if a matrix is nonnegative and primitive, then there will be a real eigenvector that dominates the others in absolute value, it will have multiplicity 1, and the eigenvector associated with it will be real and positive [C].  The adjacency matrices above are nonnegative since all the entries are 0 or 1, and for the two above I checked that they are primitive; in Example 1, the square of the matrix was positive, and in Example 2, it took the fourth power of the matrix before getting a positive matrix.  We don't use the adjacency A, per se, but instead we use B = A + I when we put 1s in the diagonal.  Try a bipartite graph and see that the powers of A will never be positive, and thus A is not primitive in that case, but B = A + I will be.

Straffin discusses the how of the Gould index in more detail, and discusses its connection to finding the dominant team in a round robin tournament and measuring the importance in nodes in a communications network.  He has a significant list of references to examples of this method along with references to other uses of linear algebra and graphs in geography.  This method is a beginning for the mathematics behind the algorithm used in PageRank used by Google; however, the adjacency matrix (with 1s on the diagonal) is not primitive and is too large to find the eigenvalues and eigenvectors directly.  But that is a discussion for another day.

Questions:  When this model is applied to historical travel routes, the trade center predicted by the model does not always match the trade center that develops.  Non-geographical issues may be involved here, such as politics and wealth, but it is clear that the model does not take into account the time of travel.  Maybe there is a train between two towns for quick access, but two others are only accessible on foot through a mountain pass.  Can we change the results for Example 2 above by considering a weighted graph instead?  If so, should we weight with time of travel or the reciprocal of time of travel?  How would the diagonal elements be weighted?

The nth power of an adjacency graph gives the number of paths of length n between vertices x and y in the (x, y) position.  Could this be used in someway to predict the trade center?

In Gould's article is a study of the travel routes of Uganda in 1921 and 1935, and Straffin's paper has references to other studies.  Can you reproduce these results?

References:

[C] Hal Caswell, Matrix Popoulation Models, Sinauer, 1989.

[G] P. R. Gould, "On the geographical interpretation of eigenvectors,"  Transactions of the Institute of British Geographers, No. 42 (Dec., 1967), pp. 53-86.

[S] Phillip D. Straffin, "Linear Algebra in Geography: Eigenvectors of Networks," Mathematics Magazine, Vol. 53, No. 5 (Nov., 1980), pp. 269-276.